Reading your kWh usage meter takes less than five minutes and requires no special tools beyond the meter itself, whether you’re checking the digital display on your physical unit or logging into your utility’s online portal. Most smart meters update consumption data hourly, giving you a precise picture of how much electricity you’re using and when.
Understanding your electricity consumption starts with knowing where to look and what the numbers mean. Traditional analog meters display a running total through spinning dials, while digital meters show cumulative kilowatt-hours on an LCD screen. Smart meters add real-time data streams that many utilities now make available through web dashboards and mobile apps, often breaking down usage by hour or even 15-minute intervals.
The practical benefit goes beyond satisfying curiosity. Tracking your meter readings reveals patterns that billing statements miss. You might discover that your air conditioner runs more than expected during afternoon hours, or that phantom loads from electronics add up to dozens of kilowatt-hours each month. Energy professionals recommend regular meter checks because they transform abstract utility bills into tangible feedback about household consumption.
This guide walks through both physical meter reading and digital access methods, covering what to prepare before you start, how to stay safe around electrical equipment, step-by-step reading procedures for different meter types, and how to verify your readings match your utility’s records. You’ll learn to interpret the data your meter provides and use those insights to make informed decisions about your energy use.
What You Need to Access Your kWh Usage Data
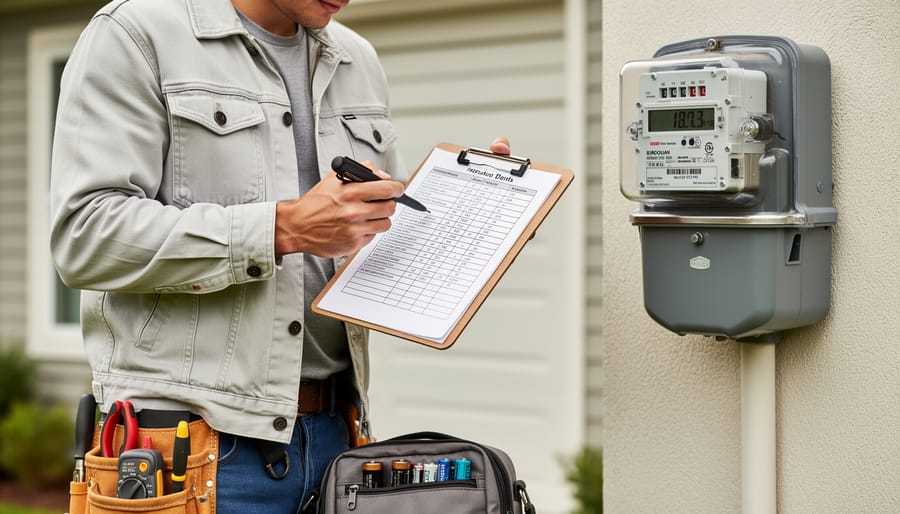
Accessing your kWh usage data requires different tools depending on whether you’re reading the physical meter or checking digital platforms. For most households, you’ll use a combination of both methods to get the complete picture of your electricity consumption.
For reading the physical smart meter on your property, keep these items handy:
- A flashlight or headlamp for reading outdoor meters in low light or evening hours
- A notepad and pen, or your smartphone’s notes app, to record readings
- Your camera phone to photograph the display for reference
- Your utility account number, typically found on your electricity bill
Digital access requires a different set of credentials. You’ll need your utility account login information, which you can create through your provider’s website if you haven’t already registered. Most utilities now offer dedicated mobile apps for iOS and Android that provide the same data as their web portals. A smartphone, tablet, or computer with internet access completes your digital toolkit.
Smart meter displays vary by manufacturer and utility provider. Some models feature LCD screens that cycle through multiple data screens when you press a button, while others use LED displays that show readings automatically. Digital platforms typically present your data through interactive graphs and charts, allowing you to view consumption by hour, day, week, or month. The physical meter shows your cumulative kWh total, while digital access reveals granular usage patterns that help identify when and how you consume electricity throughout the day.
Safety Precautions and When Not to Read Your Meter
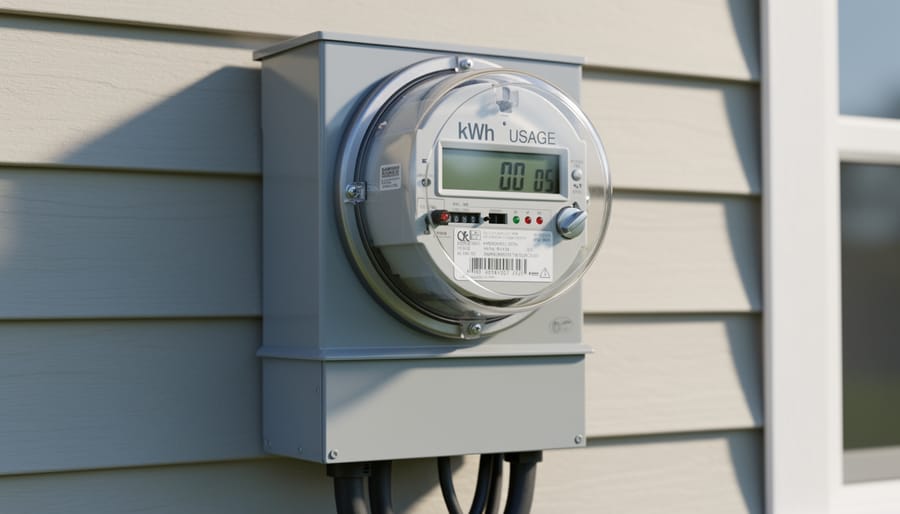
Never approach your smart meter if you notice exposed wiring, physical damage to the meter enclosure, buzzing sounds, or burning smells, these indicate serious electrical hazards that require immediate utility company notification. Similarly, avoid accessing outdoor meter boxes during severe weather, particularly thunderstorms, heavy rain, or icy conditions that create slip hazards or increase electrical risk.
Most smart meters are designed for external viewing without opening enclosures, but if your meter sits inside a locked cabinet or in a location requiring ladder access, contact your utility provider to request a reading or relocate the display. Professional meter technicians have proper safety equipment and training to handle situations involving difficult access points, suspected meter malfunctions, or readings that appear stuck or cycling erratically.
You should also defer to utility professionals when dealing with older properties where meter installations may not meet current electrical codes, or if you’re physically unable to safely reach the meter location. Many utilities offer remote reading services or can install secondary displays inside your home, eliminating the need to access outdoor equipment altogether. If your meter sits near aggressive animals, underground electrical vaults, or within construction zones, requesting professional assistance is both safer and often faster than attempting access yourself.
How to Read Your Physical Smart Meter Display
Understanding Multi-Screen Displays
Most smart meters rotate through multiple information screens, each displaying different metrics. To navigate these displays, look for a small button, usually labeled “Select,” “Display,” or marked with an icon, on the meter’s front panel. Press this button to cycle forward through available screens.
The screens typically include cumulative kWh usage (your total consumption since installation), current power draw in kilowatts (kW), voltage readings, and sometimes time-of-use information. The cumulative kWh reading is what matters most for tracking your consumption. You’ll recognize it by the “kWh” unit label and a larger number that never resets. In contrast, the instantaneous power reading shows your current consumption at that exact moment, a much smaller, fluctuating number measured in kW.
Some meters automatically cycle through screens every few seconds during smart meter reading. If yours does this, simply wait for the kWh screen to appear. Take note of which screen position holds your cumulative usage, it’s often the first or second screen, so you can quickly find it during future checks without cycling through everything.
Recording and Tracking Your Readings
Taking readings weekly builds a consumption baseline that reveals patterns invisible on monthly bills. Use a simple notebook, spreadsheet, or smartphone note app, record the date, time, and cumulative kWh shown on your meter. Different meter display types may require you to cycle through screens to find the total usage figure, so note which screen displays it for consistency.
Calculate your period consumption by subtracting the previous reading from the current one. For example, if Monday’s meter shows 4,532 kWh and the following Monday shows 4,607 kWh, you used 75 kWh that week. Monthly tracking works similarly but captures broader trends like seasonal heating or cooling impacts.
Regular monitoring helps you spot unusual spikes, a sudden jump might indicate a malfunctioning appliance or someone leaving the space heater on overnight. Many households find that simply tracking consumption raises awareness enough to prompt conservation habits, even without formal analysis.
How to Access Your kWh Data Through Digital Platforms
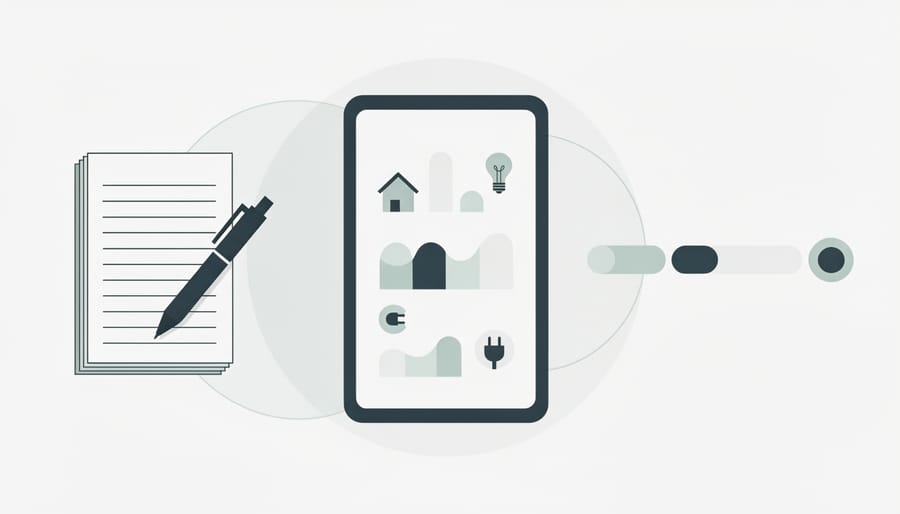
Most utility providers now offer detailed digital access to your smart meter data, often with granular hourly breakdowns that surpass what the physical display shows. Digital platforms let you spot patterns, compare time periods, and export consumption records, capabilities that transform energy tracking from a monthly bill surprise into active energy management.
- Navigate to your utility company’s website or download their mobile app from the App Store or Google Play. Most major providers now maintain dedicated apps specifically for smart meter data access.
- Create an account or log in using your existing credentials. You’ll typically need your account number (found on any utility bill), service address, and an email for verification. First-time setup often includes a one-time verification code sent via text or email.
- Locate the usage dashboard or energy monitoring section. Labels vary, look for “My Usage,” “Energy Dashboard,” “Usage Analytics,” or similar headings in the main navigation menu.
- Select your desired time period. Most platforms offer daily, weekly, monthly, and annual views. Toggle between these to see different consumption patterns, hourly data reveals which appliances drive your usage during specific times.
- Download or export your data if needed. Many portals provide CSV or Excel downloads, useful for creating personal tracking spreadsheets or analyzing trends over multiple billing cycles.
The advantage of digital access extends beyond convenience. While your physical meter shows a cumulative total requiring manual calculations to determine period usage, web portals and apps automatically calculate consumption for any timeframe you select. You can compare this month to last month, spot unusual spikes on specific days, or identify that Wednesday afternoons consistently show higher usage than other weekday afternoons.
Real-time or near-real-time monitoring, available on some platforms, updates every 15 to 30 minutes rather than once daily. This immediacy helps you test whether turning off that basement dehumidifier actually reduces your draw as much as expected. You can make a change, check back within the hour, and see measurable results rather than waiting for next month’s bill.
If your utility’s portal seems limited, check whether they integrate with third-party energy management platforms. Some smart meter systems share data with apps that offer enhanced visualization, goal-setting features, and appliance-level consumption estimates based on usage signatures.
Interpreting Your kWh Usage Numbers
Understanding your kWh reading starts with recognizing that one kilowatt-hour represents the energy used by a 1,000-watt appliance running for one hour. If your meter shows 45,678 kWh today and showed 45,528 kWh seven days ago, you’ve consumed 150 kWh that week, about 21.4 kWh per day. This daily rate matters more than the cumulative total because it reveals your actual consumption pattern.
To translate readings into costs, multiply your consumption by your electricity rate. If you used 150 kWh at £0.24 per kWh, that week cost £36. Your utility bill shows the exact rate, which often varies by time of day or season depending on your tariff. Understanding how smart meters track these patterns helps you see where spikes occur.
Average household consumption varies considerably. A small flat might use 15-20 kWh daily, while a four-bedroom house with electric heating can hit 50-60 kWh in winter. Summer usage typically drops 20-40% in moderate climates as heating needs disappear, though air conditioning reverses this pattern in hot regions. Compare your rate against these benchmarks rather than just the absolute number.
Watch for sudden jumps that don’t match your routine. A jump from 30 kWh to 45 kWh daily without obvious cause, no cold snap, no guests, no new appliances, warrants investigation. It might signal a malfunctioning device running continuously or an efficiency issue worth addressing.
Verifying Your Reading and Next Steps
Compare your meter reading with your most recent utility bill to verify accuracy. The bill’s closing reading should match what your meter displayed on that date. If you recorded a reading of 12,450 kWh and your bill shows 12,448 kWh for the same date, that two-unit difference falls within normal variation.
When physical and digital readings don’t align, check the timestamp on each. Smart meters update digital platforms every 15 minutes to an hour, so a lag between sources is normal. If the discrepancy exceeds 50 kWh or persists for several days, contact your utility provider. They can remotely diagnose meter communication issues or schedule a technician visit if hardware problems exist.
Calculate your daily usage by subtracting an earlier reading from a current one, then dividing by the days elapsed. If your meter showed 12,300 kWh on March 1st and 12,600 kWh on March 31st, you used 300 kWh over 30 days, an average of 10 kWh daily. This baseline helps you spot unusual spikes that might indicate appliance malfunctions or energy waste.
Use your verified readings to set reduction goals. Track weekly consumption and experiment with behavior changes: running the dishwasher during off-peak hours, adjusting the thermostat, or unplugging phantom loads. Many utilities offer energy audits or rebates when you demonstrate consistent monitoring habits.
Document your readings in a simple spreadsheet or notebook. Regular tracking transforms abstract kWh numbers into actionable insights about your household’s energy patterns.
Common Questions About kWh Meter Readings
Why does my smart meter show different readings than my utility bill?
Your meter displays real-time cumulative usage, while bills typically reflect readings from a specific billing cycle date. If you check mid-cycle, your current meter reading will naturally be higher than the last billed amount. Additionally, some utilities apply estimation or rate tiers that affect the bill total.
How often should I check my kWh usage?
Weekly checks provide enough data to spot patterns without becoming tedious. Monthly monitoring works if you simply want to verify bills, while daily checks help when you’re actively trying to reduce consumption or testing the impact of new appliances.
Can I reset my smart meter’s kWh reading?
No. Smart meters maintain cumulative totals controlled by your utility, and tampering with readings is illegal. To track usage over specific periods, record the starting reading and subtract it from the ending reading rather than attempting to reset the meter itself.
What causes sudden spikes in my kWh readings?
Large, temporary increases usually trace to high-draw appliances running longer than usual (space heaters, electric water heaters, air conditioning), seasonal changes, or guests staying in your home. Check your digital platform’s hourly breakdown to pinpoint when the spike occurred.
If your meter display stays blank even after pressing the activation button, the unit may have a power issue or LCD failure. Contact your utility for a service check rather than attempting repairs yourself. Some older smart meter models experience display malfunctions while still transmitting accurate data to the utility, so your digital portal may show correct readings even when the physical screen does not.
When readings seem unusually low, verify you’re looking at the cumulative kWh total rather than instantaneous power draw (measured in kW). The cumulative reading steadily increases and never decreases, while instantaneous measurements fluctuate based on what’s currently running in your home.
Regular monitoring helps you understand your household baseline and quickly identify changes. Comparing usage across similar months in different years accounts for seasonal variations and helps separate normal fluctuations from genuine efficiency improvements or emerging problems with appliances.
Regular monitoring of your kWh usage transforms your smart meter from a passive billing device into an active energy management tool. Whether you choose to check your physical meter display weekly or review detailed consumption patterns through your utility’s digital platform, the simple act of tracking creates awareness that naturally leads to more thoughtful energy use. Start with whichever access method feels most comfortable, many people find that beginning with monthly physical readings builds familiarity before they explore the richer hourly data available online. As you develop a monitoring routine, you’ll gain insights that extend beyond basic consumption tracking, enabling you to spot usage anomalies, verify billing accuracy, and make informed decisions about everything from appliance efficiency to solar panel investments.